logotype
header-blog-post

Otitis Cytology in Dogs: A Vet’s Guide to Ear Cytology Interpretation 

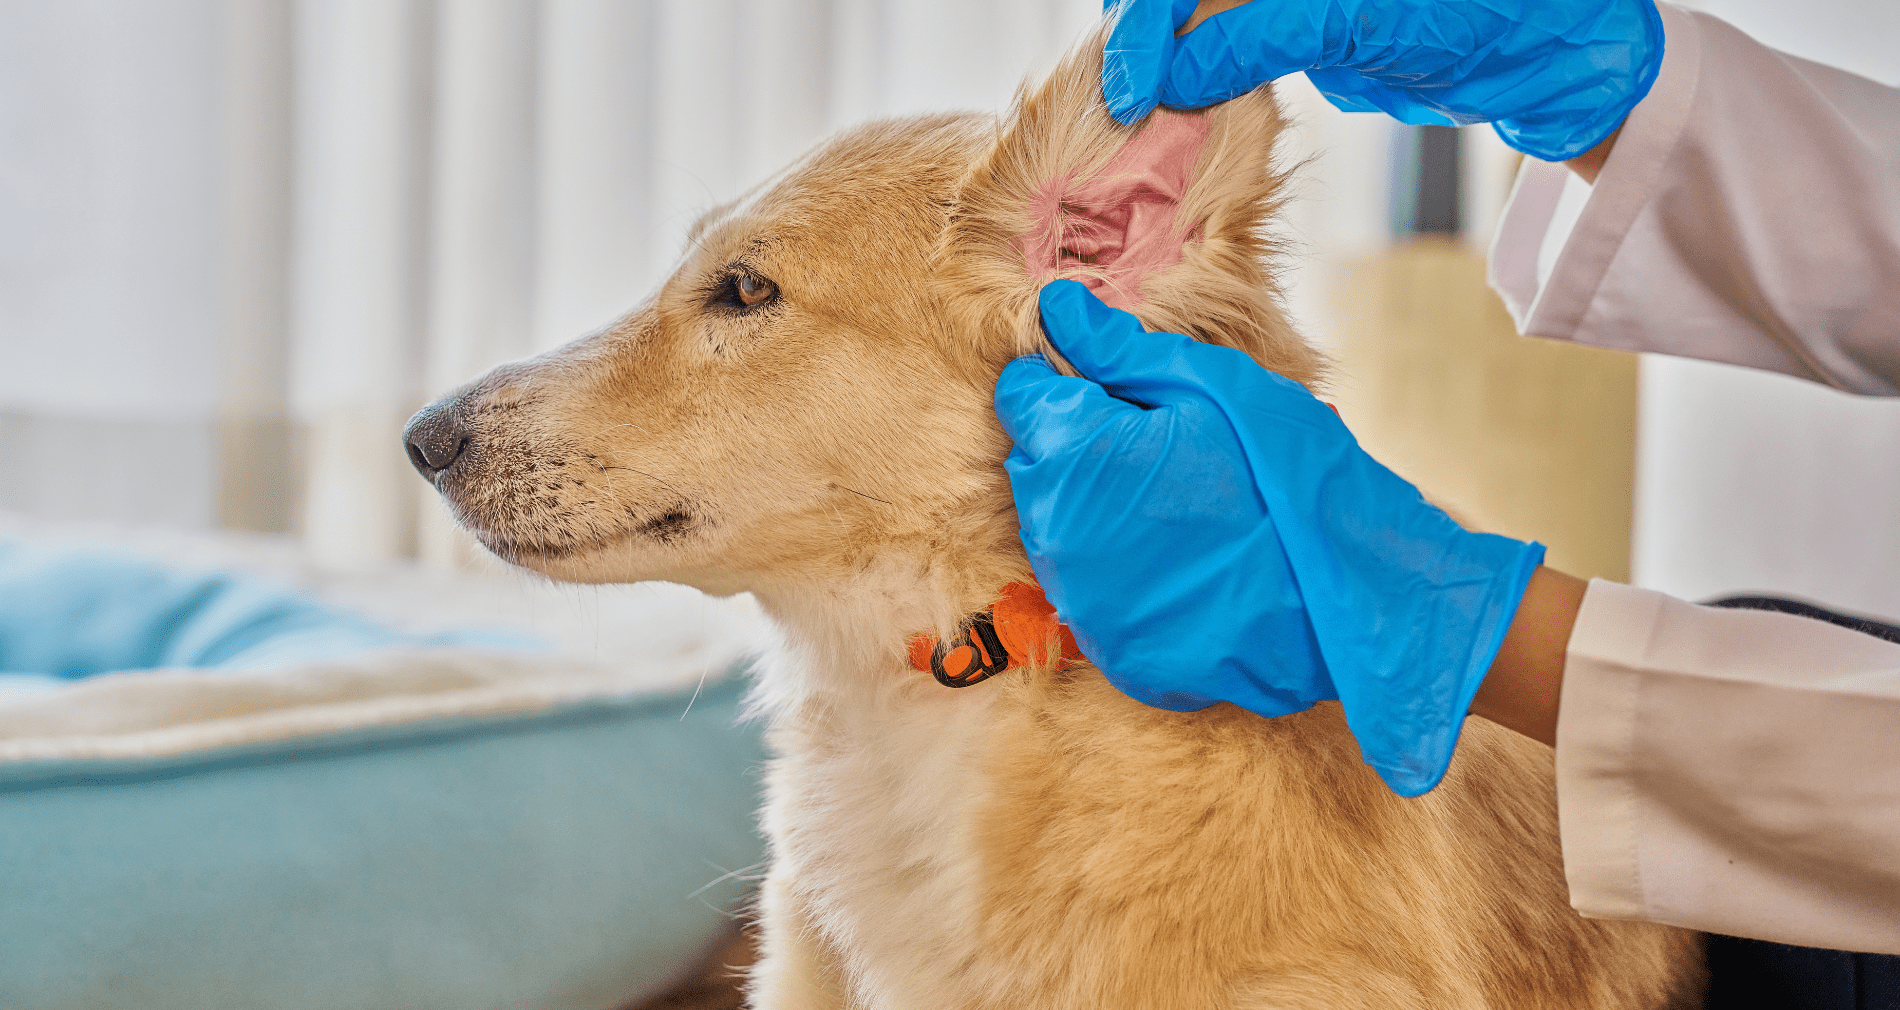
Otitis externa is one of the most common reasons dogs and cats end up in the exam room, and it rarely resolves with a single visit. A VetCompass study of dogs under UK primary veterinary care found a one-year period prevalence of 7.30% across a random sample of more than 22,000 dogs, with breed and ear carriage ranking as the highest risk factors. Feline cases occur at a lower but still clinically meaningful rate. 

Otitis cytology in dogs is what turns that exam room presentation into a treatment decision. Getting the diagnosis right the first time depends on it, but staining variability and turnaround time can slow the workflow down at exactly the moment a clear answer matters most. 

This post breaks down how to interpret ear cytology findings, how to tell Malassezia from cocci on the slide, what is actually driving diagnostic inconsistency between clinics, and how faster, more standardized slide prep is changing that workflow for practices that see these cases every week. 

Why Cytology Is the Standard for Otitis Externa Diagnosis 

Otitis externa is a multifactorial disease. Effective, lasting treatment depends on separating primary causes (like allergies or parasites) from secondary infections and the perpetuating factors that keep an ear from healing even after the underlying cause is addressed, a framework outlined in the Journal of the American Veterinary Medical Association’s review on managing recurrent otitis externa. 

Bacterial culture is sometimes used to guide therapy, but it has real limitations in the ear. A 2022 study published in Veterinary Sciences compared cytology, bacterial culture, and 16S amplicon profiling in dogs with chronic suppurative otitis externa and found only moderate agreement between cytology and culture results, around 60% of samples. The same study noted that over a third of the bacterial species detected through DNA sequencing at meaningful abundance levels were missed by culture entirely. Culture and susceptibility panels are also built around blood-level drug concentrations, which do not reflect the much higher concentrations achieved with topical therapy, one reason many dermatologists rely on cytology as the primary diagnostic and monitoring tool rather than defaulting to culture. 

Cytology, by contrast, gives an immediate read on what is actually present on the slide: cocci, rods, yeast, and the inflammatory response driving clinical signs. That immediacy is exactly why the Merck Veterinary Manual lists cytological evaluation, alongside history and otoscopic exam, as a core part of otitis externa diagnosis, and why it should be performed at the initial visit and at every recheck, not just when a case looks complicated. Accurate ear cytology interpretation at each of those visits is what actually drives the treatment decision, not the culture result that may take days to come back. 
Ear Cytology Interpretation: What You Are Looking For on the Slide 

A useful ear cytology read typically covers a few key findings: 

What you see 

What it suggests 

Clinical takeaway 

Cocci 

Often Staphylococcus species 

Usually more straightforward to resolve with topical therapy 

Rods 

Commonly Pseudomonas or other gram-negatives 

Signals a more complicated case; may need a different treatment approach and closer monitoring 

Yeast (Malassezia) 

Frequent contributor in both dogs and cats 

Shapes topical therapy choice; often present alongside bacteria, so a slide is not fully read until both are accounted for 

Neutrophils (especially degenerated) 

Active bacterial process 

Higher counts support more aggressive treatment 

Few to no inflammatory cells 

Case may be resolving, or not truly infectious 

Worth considering allergic otitis rather than infection 

Intracellular organisms 

More established, significant infection 

May warrant more aggressive treatment than extracellular organisms alone 

Organism density (few vs. sheets) 

Distinguishes early/resolving cases from active infection 

Density, not just presence, helps determine whether topical therapy is still needed 


When rods dominate the slide, the stakes go up since these organisms are often associated with greater antimicrobial resistance concerns. A retrospective analysis of bacterial isolates from dogs with pyoderma and otitis externa found that while Staphylococcus species, particularly S. pseudintermedius, were the most common isolates, Pseudomonas and Proteus were also frequently identified, and multidrug resistance was a recurring finding. The authors recommend prioritizing topical therapy and reserving systemic antibiotics for exceptional cases after susceptibility testing, which is another argument for cytology as the tool that guides the topical plan. 

What Counts as an Otitis Externa Cytology Positive 

This is where practices diverge more than most clinicians realize. There is no single agreed threshold for calling an ear cytology positive. Commonly cited cutoffs for yeast and bacteria per high-power field vary between references and between individual dermatologists, and none of them are universally adopted. 

That means the call often comes down to the reader’s judgment of density, morphology, and the inflammatory picture, applied to whatever the slide happens to look like. Which makes slide quality the variable that quietly decides borderline cases. 

None of this is useful if the sample itself is inconsistent. A comparative study of two ear cytology collection methods in dogs with otitis externa found that a cotton-tipped swab technique and a deep-canal aspiration technique produced different yields of neutrophils, a reminder that consistent sampling matters just as much as consistent interpretation. A well-collected sample that then sits on an inconsistently stained slide still leaves room for two clinicians to read the same ear differently. found that a cotton-tipped swab technique and a deep-canal aspiration technique produced different yields of bacteria, yeast, and inflammatory cells, a reminder that consistent sampling matters just as much as consistent interpretation. A well-collected sample that then sits on an inconsistently stained slide still leaves room for two clinicians to read the same ear differently. 


Produced statistically different yields of neutrophils, a reminder that  

Malassezia vs. Cocci on Ear Cytology: Telling Them Apart and Why It Changes Treatment 

The single most common read in ear cytology is distinguishing yeast from bacteria, and most slides contain both. 

Malassezia are unmistakable once you have seen a few. They are roughly 3 to 8 micrometers, several times the size of a coccus, and shaped like a peanut, a snowman, or a bowling pin depending on which textbook you learned from. That shape comes from broad-based unipolar budding, where the daughter cell separates from one pole without pinching off into a neat sphere. They take up Romanowsky stain readily and appear deep blue to purple. The ACVD clinical consensus guidelines on the biology, diagnosis, and treatment of Malassezia dermatitis in dogs and cats are the references worth keeping on hand for anything beyond identification. 

Cocci are round, roughly one micrometer, and typically appear in pairs, tetrads, or grape-like clusters. At 100x oil they read as fine purple dots against the background, and the size difference next to a Malassezia organism is dramatic enough that the two are rarely confused once both are on the same slide. 

The trouble is what mimics them. Melanin granules, keratin debris, and stain precipitate all produce small dark specks that can pass for cocci to a tired eye at the end of a long day. Stain precipitate in particular tends to show up when reagents are aging or dip times drift, which means the artifact most likely to be misread as bacteria is generated by the same staining inconsistency described in the next section. 

Why the distinction drives treatment: yeast and bacteria require different active ingredients in the topical. A slide read as yeast-only leads to an antifungal-weighted product, a bacteria-only read leads to an antibacterial one, and the mixed infections that make up a large share of otitis cases need both addressed. Treating only the organism that jumped out first is one of the more common reasons an ear improves partially and then stalls. 

Why Ear Cytology Results Vary Between Techs 

Even with good sampling, staining and slide prep introduce variability that has nothing to do with a clinician’s skill. Manual Romanowsky staining involves several timed dip steps, and small differences in dip time, reagent freshness, or how a slide is dried can all change how the same sample looks under the microscope. Two technicians staining the same sample, on the same day, can produce slides that look meaningfully different, which can shift how a borderline case gets read and treated, especially when organism counts are close to a threshold that determines whether a case is called infected or not. 

That inconsistency is a systemic issue built into manual staining workflows, not a reflection of individual technique or effort. It shows up most in high-volume practices, where the same tech may be staining dozens of slides a day, and in multi-doctor practices, where different clinicians may be reading slides prepared by different team members. It is also one of the harder problems to catch, since an inconsistent slide does not announce itself. It just quietly nudges a borderline read one way or the other, and the vet interpreting it usually has no way to know which one they are looking at. 

This is the gap that standardized, automated slide processing is designed to close. 

In-House Ear Cytology vs. Send-Out: What You Gain and What You Give Up 

Most practices are performing ear cytology in-house, but here are some factors to consider. 

Send-out gets you a board-certified clinical pathologist reading the slide, which is genuinely valuable for ambiguous cases, suspected neoplasia, or anything that does not fit the usual otitis picture. What it costs you is time. The traditional workflow runs prepare, package, ship, wait, review, receive report, and the ear cytology turnaround time on that sequence is typically measured in days. For a patient who is painful and an owner who wants an answer before they leave, that gap is the whole problem. 

In-house ear cytology collapses that timeline to the length of the appointment. The vet sees the slide, makes the call, and dispenses the medication topical before the client walks out. What you give up is the specialist read and, in a manual staining workflow, the consistency that a dedicated lab brings to slide prep. 

For most otitis cases the clinical question is straightforward enough that in-house wins on speed without giving up much accuracy. The cases where send-out earns its turnaround are the ones that do not look like routine otitis in the first place. The practical answer for a lot of practices is not choosing between them, but having a workflow where the routine cases resolve in-house and the unusual ones escalate to a pathologist without restarting the sample collection process. 

How the TRUVIEW® AI Microscope Speeds Up Ear Cytology Confirmation 

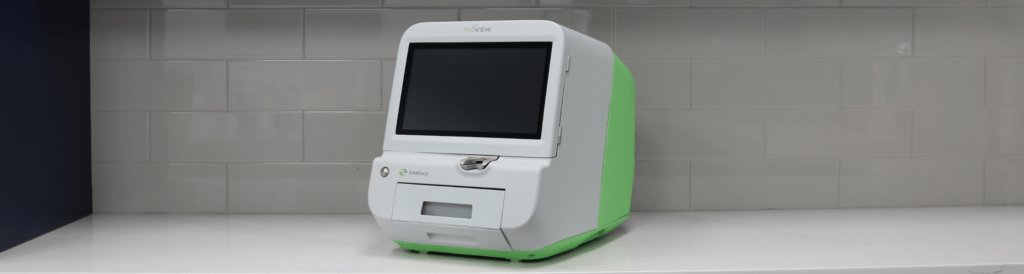
The TRUVIEW® AI microscope replaces the manual, timed-dip staining process with TRUprep® automated slide preparation. Insert the slide, and the system smears, stains, washes, dries, and digitizes it on a fixed cycle, so stain exposure, reagent volume, and drying are identical on every slide regardless of who is running the sample or how busy the clinic is that day. Instead of a tech eyeballing dip counts between appointments, every slide goes through the same standardized steps, which removes the tech-to-tech and day-to-day variability described above from the read itself. 

For ear cases specifically, the Ear Cytology Quick Scan protocol streamlines slide prep and scanning so a slide that might otherwise sit in a queue behind other cases is imaged and ready to read in minutes. For a practice running multiple otitis cases in a single day, that difference in speed adds up: same-visit answers instead of asking an owner to wait for a callback, and less time between sample collection and a treatment decision. 

The TRUVIEW system also captures and stores a digital image of every slide, which solves a second problem manual cytology does not: there is no permanent record of what the tech or vet actually saw under the scope at the time. A stored image can be pulled back up at a recheck, compared side by side with the current slide, or shared with a referring vet or a board-certified pathologist through the myZomedica® portal without needing to physically send a slide. That is a meaningful upgrade over a written note that says “moderate cocci, few WBCs” with no way to verify it later. 

That telepathology connection is also what makes the in-house vs. send-out tradeoff less of a tradeoff. Routine cases resolve during the appointment, and the unusual ones go to a pathologist from the same digitized slide, without recollecting a sample or shipping anything. 

To be clear on scope: the TRUVIEW microscope supports and speeds up cytology-based confirmation. The veterinarian is still the one interpreting the slide and making the diagnosis. The platform’s role is removing the staining variability and turnaround-time bottleneck from that process, not replacing clinical judgment. 

Ready to see how the TRUVIEW microscope’s ear cytology workflow fits into your practice? Request a demo! 

Chronic Ear Infection in Dogs: Why Cytology Consistency Matters Most Here 

Chronic otitis is where repeatable cytology matters most. Rechecks are common in these cases, since resolving the underlying cause often takes multiple rounds of treatment adjustment, and each recheck depends on an accurate read to know whether the current plan is working. 

Working up a chronic ear infection in a dog means cytology is only part of the picture. Allergic disease is the most common primary cause, and the 2023 AAHA Management of Allergic Skin Diseases in Dogs and Cats Guidelines lay out the workup for allergic otitis externa alongside the rest of the minimum dermatologic database. Endocrine disease is another recurring culprit, and the TRUFORMA® diagnostic platform runs the thyroid and adrenal assays that help diagnose at the point of care. 

This is also where inconsistent staining does the most damage. If a slide from the first visit was read as heavily infected and a recheck slide two weeks later reads as only mildly infected, is that real improvement or a difference in how the two slides were stained? Without standardization, that question is hard to answer with confidence, and it is exactly the kind of ambiguity that can lead to a treatment plan being extended, changed, or stopped based on noise rather than signal. 

A fast, standardized cytology read at each recheck makes it easier to track whether an ear is actually improving or whether the treatment plan needs to change, without adding another 24-hour turnaround to a case that is already dragging on for the owner and the patient. 

Frequently Asked Questions About Ear Cytology in Dogs 

How many yeast per HPF is abnormal on ear cytology? 

There is no universally agreed threshold, which is part of why slide-to-slide consistency matters so much. Commonly cited references suggest that more than 5 to 10 Malassezia organisms per high-power field (HPF) at 400x is considered significant, but individual dermatologists vary, and clinical signs should always factor into the interpretation. A high yeast count in an asymptomatic ear reads differently than the same count in a dog that has been scratching for weeks. 

What does a normal ear cytology look like? 

A cytology from a healthy ear typically shows low numbers of Malassezia (fewer than 5 per HPF), no bacteria, and little to no inflammatory response. Small amounts of ceruminous debris and occasional epithelial cells are expected. The absence of cocci, rods, and neutrophils is what distinguishes a normal slide from an early or resolving infection. 

How often should you recheck ear cytology? 

For active infections, a recheck cytology at two to three weeks is standard practice to confirm the infection is responding to treatment. For chronic or recurrent cases, cytology at every recheck visit is warranted regardless of how the ear looks clinically, since a slide that appears improved visually does not always match what is happening at the cellular level. Persistent organisms or a shift in organism type (cocci to rods, for example) between visits is clinically significant information that a visual exam alone will miss. 

The Bottom Line 

A quick recap for the slide in front of you: 

  • Rods, high organism density, or intracellular bacteria mean a more complicated case. Treat and monitor closely. 
  • No improvement between visits means questioning whether it is the treatment or the read before extending or switching therapy. 
  • Yeast and bacteria together means both need to be addressed in the treatment plan, not just the more obvious one. 
  • Sparse findings with ongoing signs means considering allergic otitis rather than infection. 

Otitis is one of the most common problems in small animal practice. While it is often a one-visit diagnosis, it is rarely a condition that requires just one vet visit. Getting cytology interpretation right, consistently and quickly, is not just a diagnostic nicety. It is central to getting these patients comfortable faster, giving owners a clear answer sooner, and keeping cases from cycling back through the exam room unresolved. 

© 2026 Zomedica Inc. All rights reserved. TRUVIEW is a registered trademark of Zomedica Inc. 
Chestnut horse grazing in a green pasture dotted with yellow wildflowers, with a wooden fence and trees in the background

Laminitis in Horses: What Equine Vets Need to Know About Endocrine-Driven Cases

Laminitis is one of the most painful and debilitating conditions a horse can face — and one of the most common calls an equine vet will receive. For horse owners, it’s a frightening diagnosis. For practitioners, it’s both a clinical challenge and an opportunity: to dig deeper, identify root causes, and deliver faster, more confident care. 

Understanding what drives laminitis — not just how to manage it once it’s present — is where modern diagnostics are making a real difference. Point-of-care testing is changing what’s possible in the field and in the clinic, giving equine vets the tools to do more for their patients without sending samples off to a reference lab and waiting. 

What Is Laminitis in Horses? 

Laminitis is inflammation of the laminae — the sensitive tissue that connects the coffin bone (pedal bone) to the inner hoof wall. When this tissue becomes damaged or inflamed, the structural integrity of the hoof is compromised. In severe or chronic cases, the coffin bone can rotate or sink, causing permanent damage and significantly impacting a horse’s quality of life. 

The condition can affect any horse or pony of any age or breed, though certain populations are at significantly higher risk — particularly older horses, easy keepers, and animals with underlying endocrine disorders. Laminitis can present acutely, with sudden severe lameness, or develop more gradually in horses with chronic, unmanaged systemic disease.  

What’s critical to understand is that laminitis is frequently a symptom, not the root problem. Treating the hoof without addressing the underlying cause puts horses at high risk for recurrence — and more serious episodes over time. The American College of Veterinary Internal Medicine (ACVIM) and the Equine Endocrinology Group both emphasize endocrine evaluation as a core component of any laminitis workup. 

Close-up of a horse's hoof and feathered fetlock standing in muddy wet ground, partially obscured by green foliage in the foreground

Recognizing Laminitis: Clinical Signs to Watch For 

Early recognition is essential. The sooner laminitis is identified and the underlying cause addressed, the better the prognosis for the horse. Key clinical signs include: 

  • Characteristic laminitic stance: Weight shifted back onto the heels to relieve pressure on the toes 
  • Increased digital pulse: Bounding or easily palpable pulse in the digital arteries 
  • Heat in the hooves: Warmth detectable at the coronary band or hoof wall 
  • Reluctance or refusal to move: Stiff, stilted gait or outright unwillingness to bear weight 
  • Rocking or shifting weight: Especially in horses with bilateral forelimb involvement 
  • Hoof wall changes: In chronic cases, growth rings (founder rings), divergent rings, or a dished hoof wall 

The Obel grading scale remains a useful clinical tool for characterizing severity, from Grade I (mild, intermittent weight shifting) to Grade IV (refusal to move, extreme pain). Regardless of grade, any suspected laminitis episode warrants prompt investigation — including a hard look at what may be driving it systemically. 

The Underlying Causes Vets Can’t Afford to Miss 

When a horse presents with laminitis, the hoof is where you see the problem — but the origin is often elsewhere. Two endocrine conditions are among the most significant drivers of laminitis in horses: insulin dysregulation (ID) and pituitary pars intermedia dysfunction (PPID). 

Insulin Dysregulation 

Insulin dysregulation is now recognized as one of the leading causes of laminitis in horses and ponies. Abnormally elevated insulin levels — whether from diet, obesity, or an underlying metabolic disorder — directly trigger laminitic episodes. Horses with a history of laminitis, easy-keeper body condition, or cresty necks should be evaluated for ID as a matter of course. 

Current options for detecting risk of hyperinsulinemia-associated laminitis (HAL) include resting insulin measurement and the oral sugar test (OST), which provides a dynamic picture of insulin response and is recommended by the Equine Endocrinology Group as the preferred screening method for horses and ponies on managed diets. The OST requires post-challenge insulin measurement at 60–90 minutes, making fast, in-clinic turnaround especially valuable. 

TRUFORMA diagnostic device next to a TRUFORMA eACTH adrenal test cartridge for veterinary use

PPID (Equine Cushing’s Disease) 

Pituitary pars intermedia dysfunction is the most common endocrine disorder in older horses. PPID is caused by degeneration of dopaminergic neurons in the hypothalamus, which leads to overproduction of ACTH and other pituitary hormones. Elevated ACTH is associated with elevated cortisol synthesis, and increased laminitis risk — along with a host of other clinical signs including hypertrichosis, muscle atrophy, weight loss, polydipsia, and recurrent infections. 

The prevalence of PPID is significant: roughly 1 in 5 horses over the age of 15 is affected, with prevalence rising to approximately 30% in horses over 30. And while hypertrichosis (the classic long, curly coat that fails to shed) is the most recognizable sign, many horses present with subtler symptoms — including laminitis — well before the haircoat changes appear. 

It’s also worth noting the seasonal ACTH rise: in the late summer and autumn months (typically August through October in the Northern Hemisphere), horses naturally experience an elevation in ACTH levels. In PPID-affected horses, this seasonal rise is exaggerated and directly associated with increased laminitis risk. The Equine Endocrinology Group’s PPID guidelines recommend adjusted seasonal reference ranges during this window and advise extra vigilance for laminitis episodes in the fall. Proactively screening older horses ahead of this period — and communicating that recommendation to horse owners — is one of the highest-value things an equine practitioner can do. 

For any horse presenting with laminitis, especially in middle age or older, ruling out PPID and insulin dysregulation isn’t optional. It’s foundational to good care. 

Traditional Diagnostic Methods — and Their Limitations 

Diagnosing endocrine-driven laminitis has historically meant sending samples to a reference laboratory for ACTH or insulin measurement. Current standard-of-care options include: 

  • Baseline endogenous ACTH (eACTH) measurement for PPID diagnosis in horses with overt clinical signs 
  • TRH stimulation testing, in which thyrotropin-releasing hormone is administered intravenously and ACTH is measured at prior to injection and 10 minutes post-injection — the recommended method for detecting early-stage PPID before clinical signs are pronounced 
  • Resting insulin and the oral sugar test (OST) for evaluating insulin dysregulation 


These are well-validated approaches, and the Equine Endocrinology Group’s published guidelines remain the clinical reference standard for when and how to use them. But each of these tests — particularly eACTH measurement — comes with real-world logistical constraints that reference lab workflows struggle to address. 

Endogenous ACTH is extremely labile. The hormone degrades rapidly at room temperature — studies show that samples can lose more than 50% of their eACTH concentration within 24 hours of collection, with meaningful degradation beginning as early as two to four hours. Strict cold-chain protocols are required from the moment of collection through arrival at the lab. Any deviation — a warm shipping environment, a handling delay, a delayed centrifugation step — can yield results that don’t reflect the horse’s true hormone levels. Erroneous values mean diagnostic uncertainty, which means delayed treatment. 

Turnaround time adds another layer of friction. Reference lab results typically take 24 hours or more — not counting shipping time and weekend closures. That means a second conversation with the horse owner, a callback, and a gap between testing and treatment initiation. For a horse already in pain, that delay matters. 

Insulin testing faces similar challenges. The OST in particular requires a timed post-challenge draw, making fast, reliable on-site measurement significantly more practical than a reference lab send-out. 

These aren’t failures of the reference lab model — they’re inherent constraints of the workflow. But they are constraints that newer technology is now designed to address. 

How The TRUFORMA® Diagnostic Platform Is Changing the Diagnostic Process 

For equine practitioners ready to bring endocrine diagnostics in-house, the results speak for themselves — and for the horse owner who no longer has to wait. 

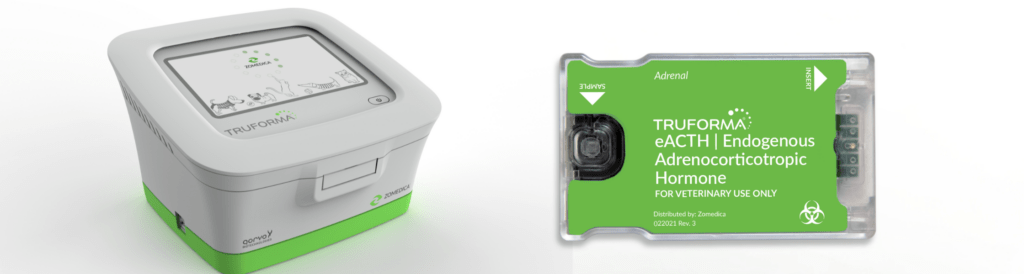
The TRUFORMA® platform from Zomedica is built on bulk acoustic wave (BAW) technology — a non-optical, fluorescence-free detection system originally developed for use in telecommunications and aerospace. It’s available at the point of care in veterinary clinics and in the field, and it’s purpose-built to address the sample handling and turnaround limitations of reference lab workflows. Learn more at zomedica.com/truforma → 

TRUFORMA eACTH Assay for Equine Plasma 

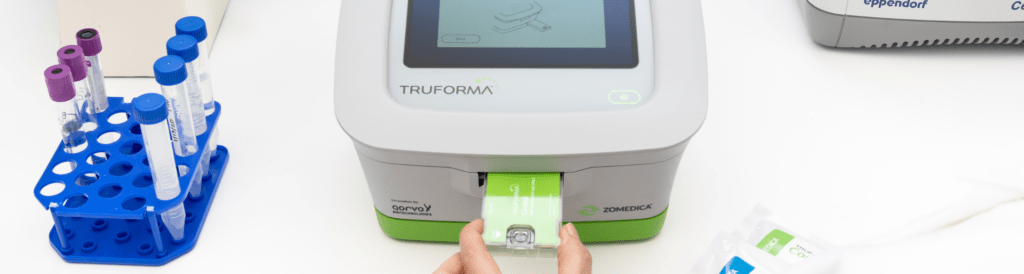
Thanks to the TRUFORMA platform, sample handling challenges associated with shipping are substantially reduced — meaning results that more accurately reflect the horse’s actual hormone status. Performance data supports its use with confidence. The assay demonstrated high correlation with the Siemens IMMULITE reference lab assay (R=0.96), with minimal overall bias. The dynamic range of 5–1,250 pg/mL covers both the low end relevant to nuanced clinical decisions and the high concentrations associated with pronounced PPID — without dilution or additional processing steps. Results are available in under 20 minutes, compared to 60+ minutes for the reference lab workflow (not including shipping time). 

TRUFORMA Equine Insulin Assay 

The TRUFORMA equine insulin assay screens for insulin dysregulation using equine EDTA plasma, with two run protocols: a Default protocol for general screening (dynamic range 7.5–400 µU/mL) and an Auto Dilute protocol for follow-up on high-concentration samples (100–1,500 µU/mL). Precision data showed a coefficient of variation of 7.1–10.2% for the Default protocol and 5.6–6.8% for Auto Dilute — and correlation with radioimmunoassay reached R=0.98 across 114 equine samples. 

The fast turnaround makes TRUFORMA particularly well-suited to OST workflows, where a 60–90 minute post-challenge draw can be processed and interpreted the same day — ideally before the horse owner leaves the property. 

Together, these two assays give equine practitioners the ability to test for the two most significant endocrine drivers of laminitis in a single clinic visit — with reference-lab quality results in hand before the horse owner leaves. 

 Hands inserting a test cartridge into the TRUFORMA point-of-care diagnostic device, with sample tubes and a lab analyzer in the background

What BAW Technology Means in Practice 

Unlike traditional enzyme-based immunoassays that rely on optical detection, BAW biosensors measure the mass accumulated on a sensor surface directly, creating a frequency shift proportional to the amount of analyte present. The result is a highly precise, reliable measurement that doesn’t require large, expensive instrumentation or radioactive substances — and that performs consistently across instruments and operators. The compact, simple design of the TRUFORMA platform requires minimal training and fits into field and clinic workflows without disruption. 

What This Means for Your Practice 

For equine vets, the ability to test and treat in the same visit isn’t just a clinical advantage — it’s a practice differentiator. 

When a horse owner brings in a laminitis case and you can run an eACTH and insulin panel on-site, explain the results in real time, and begin a treatment conversation before they leave, you’ve delivered a different level of care. That builds trust, reduces the back-and-forth of callback consultations, and positions your practice as a progressive, well-equipped resource for equine health. 

Early detection of PPID and insulin dysregulation also means earlier treatment — which reduces the risk of laminitis episodes, more severe disease progression, and the difficult conversations that come with advanced cases. For the horse, earlier is better. For the horse owner, earlier is reassuring. For your practice, delivering that kind of proactive care is meaningful. 

Zomedica’s Customer Appreciation Program provides the TRUFORMA instrument with no capital outlay and no monthly minimums — lowering the barrier to bringing this technology in-house. Contact us to learn more! 

Frequently Asked Questions About Laminitis in Horses 

What is laminitis in horses? 

Laminitis is inflammation of the laminae, the tissue bonding the coffin bone to the inner hoof wall. It causes significant pain and lameness, and in severe cases can lead to permanent structural damage of the hoof. It is often a sign of an underlying systemic condition rather than a standalone disease. 

What causes laminitis in horses? 

Laminitis has several potential triggers, but endocrine disorders — particularly insulin dysregulation and PPID  — are among the conditions most frequently associated with its development. Other triggers include dietary carbohydrate overload, systemic illness, and mechanical overloading of a limb. 

What are the signs of laminitis in a horse? 

The classic signs include a laminitic stance (weight shifted to the hindquarters), bounding digital pulse, heat in the hooves, and reluctance to move. Chronic cases may show hoof wall changes such as founder rings or a dished toe. 

Can laminitis be cured? 

Acute laminitis can often be managed effectively with early intervention, particularly when the underlying cause is identified and addressed. Chronic laminitis with significant coffin bone rotation is more difficult to reverse, though many horses can be managed to a good quality of life with appropriate farriery, diet, and medical management. 

How is PPID connected to laminitis? 

PPID causes overproduction of ACTH, which leads to elevated cortisol levels. This hormonal dysregulation disrupts normal metabolic processes and is thought to increases a horse’s susceptibility to laminitis — particularly during the autumn seasonal ACTH rise. 

How is insulin dysregulation diagnosed in horses? 

Resting insulin measurement and the oral sugar test (OST) are the primary diagnostic tools. The OST measures insulin response to a sugar challenge and is the preferred screening method for horses on managed diets. Point-of-care testing with the TRUFORMA platform allows for fast, in-clinic insulin measurement, making same-visit diagnosis and treatment planning possible. 

Ready to See the TRUFORMA Diagnostic Platform in Action? 

Laminitis will always be part of equine practice. But the diagnostic process that follows a laminitis diagnosis doesn’t have to mean days of waiting, sample handling uncertainty, and delayed treatment decisions. 

TRUFORMA gives you the tools to go further, faster — with reference lab quality results at the point of care, in under 20 minutes. 

Learn more about the TRUFORMA eACTH and Equine Insulin assays here, or contact your Zomedica sales representative to request a demo: 

734.369.2555  |  sales@zomedica.com  

©2026 Zomedica Inc. All rights reserved.  TRUFORMA® is a registered trademark of Zomedica Inc.  

Disclaimer: The information provided on this blog is for general informational and educational purposes only. It is not intended as medical advice and should not be used as a substitute for professional medical guidance. Always consult a qualified healthcare provider before making any health‑related decisions.

Header Image cat

In-Clinic Feline Diagnostics: Cobalamin, Folate & Thyroid Testing 

Based on clinical insights from Dr. Gary Oswald’s webinar, If Cats Were in Charge: Feline In-Clinic Tests They Would Want You to Know About * 

In-clinic feline diagnostics have changed what’s possible in a single appointment. A cat comes in with weight loss, chronic soft stools, and a dull coat — the signs could point to a dozen different conditions. Previously, the visit often ended the same way: draw blood, send it out, wait two to three days, then call the client with a plan. For cats who deteriorate quickly, that gap matters. Running cobalamin, folate, and thyroid panels at the point of care means the diagnostic question and the diagnostic answer can live in the same appointment — with results in hand before the cat leaves the building. 

Why Cobalamin Testing Belongs in Your Feline Workup 

Cobalamin — more commonly known as vitamin B12 — is a required co-factor in the citric acid cycle, plays an essential role in methionine synthase pathways for protein synthesis, and supports antioxidant function. Unlike dogs or humans, cats cannot synthesize cobalamin endogenously and are entirely dependent on dietary intake. They also have extremely limited hepatic storage capacity, with a half-life of less than two weeks. This means that when a cat’s intake or absorption is compromised, cobalamin deficiency can develop rapidly — and the consequences can be significant. For a thorough review of cobalamin’s role in small animal health, see Cobalamin in Veterinary Health and Disease in Today’s Veterinary Practice. 

Deficiency most commonly presents in cats with chronic intestinal disease, where the complex absorption pathway for cobalamin breaks down. Cobalamin is released from dietary protein in the stomach, bound to haptocorrin (the R protein) for transit through the acidic gastric environment, then transferred to intrinsic factor — primarily produced by the feline pancreas — in the small intestine. Intrinsic factor carries cobalamin to cubilin receptors on ileal enterocytes for absorption into the bloodstream. Any disruption along this pathway can result in deficiency. 

Clinical Presentations Associated with Cobalamin Deficiency 

The most common presentation is chronic small intestinal disease — including inflammatory bowel disease, intestinal lymphoma, food-responsive enteropathy, dysbiosis, and exocrine pancreatic insufficiency (EPI). Clinical signs mirror any chronic gastrointestinal disorder: weight loss, poor body condition, reduced appetite, soft stools or diarrhea, and intermittent vomiting. In younger cats, cobalamin deficiency may manifest as failure to thrive. In some cases, inadequate cobalamin impairs ammonia processing, resulting in central neuropathies that may resemble hepatic encephalopathy — making it worth considering cobalamin status in cats where a portosystemic shunt is suspected but cannot be confirmed. 

Once a cat becomes cobalamin deficient, the deficiency itself tends to accelerate intestinal disease progression — a compounding cycle that makes early identification and supplementation both a diagnostic and therapeutic priority. 

Interpreting Cobalamin Results and Supplementation Protocols 

Cobalamin testing requires a fasted serum sample (8–12 hours) to avoid falsely elevated results. The reference interval is >290 ng/L. Cats below 400 ng/L — even within the technical reference range — are at risk and should be considered candidates for supplementation. Below 290 ng/L indicates true deficiency; below 150 ng/L indicates tissue-level depletion with active clinical signs almost certainly present. 

Supplementation can be delivered via subcutaneous injection or orally. For injectable protocols, cats under 5 kg receive 250 mcg and cats over 5 kg receive 400 mcg, given weekly for six weeks with a recheck at week 14. Oral supplementation runs at 250 mcg daily for 12 continuous weeks, with reassessment at week 16. In both cases, the target at recheck is a supratherapeutic blood level confirming adequate resp supplementation onse. If underlying disease is ongoing — lymphoma, IBD, EPI — maintenance is typically continued long-term. There is no meaningful risk of over-supplementation; excess cobalamin is excreted. 

Folate as a Biomarker for Intestinal Localization 

Folate (vitamin B9) rarely produces systemic illness in felines on its own, and cats can obtain it from a broad range of dietary sources as well as from intestinal microbiota synthesis. Its real diagnostic value is as a biomarker — specifically, a spatial indicator of where intestinal dysfunction is occurring. The normal reference range for feline folate is 9.7–21.6 mcg/L, and deviations in either direction carry distinct clinical meaning. 

Elevated folate above 21.6 mcg/L is not clinically harmful, but it reliably signals dysbiosis. When bacteria in the intestinal microbiome produce excessive folate, serum levels rise — pointing to a disrupted microbiome that warrants dietary evaluation, probiotic or prebiotic therapy, and in persistent cases, fecal microbial transplant. Low folate below 9.7 mcg/L tells a different story entirely. Because folate is only absorbed in the duodenum and proximal jejunum, hypofolatemia specifically implicates upper small intestinal disease — and is a direct prompt to image the upper GI tract, run a feline pancreatic lipase assay, and determine whether the workup should proceed toward biopsy or immunosuppressive therapy. 

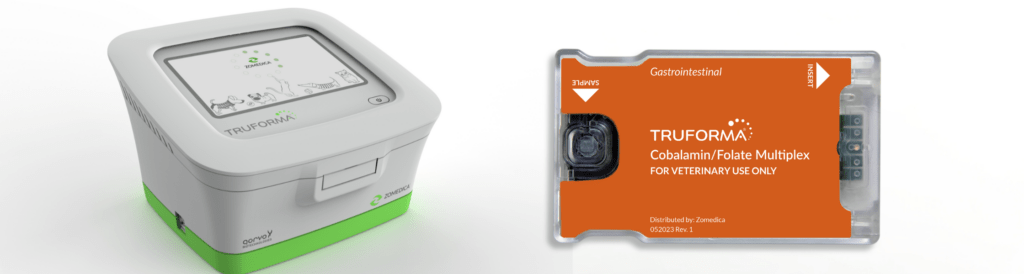
As the Merck Veterinary Manual notes, folate is absorbed primarily by the proximal small intestine while cobalamin is absorbed distally — making the two tests a practical spatial diagnostic tool when run together. Zomedica recently expanded the TRUFORMA® in-clinic biosensor testing platform to include feline use for this multiplexed cobalamin and folate assay, previously available for canine patients only, delivering both results in under 25 minutes. 

Feline Hyperthyroidism: Choosing the Right Thyroid Tests 

Feline hyperthyroidism is the most common endocrine disorder in older cats, and total T4 remains the standard first-line screening test. A T4 above 3.82 mcg/dL in a cat with appropriate clinical signs — weight loss, poor body condition, PUPD, panting, hyperactivity, vomiting — is highly consistent with hyperthyroidism, with sensitivity around 91% and specificity above 99%. For straightforward presentations, a single elevated T4 in the right clinical context is diagnostically sufficient. 

But a meaningful subset of cases are not straightforward. Cats with concurrent illness — IBD, chronic kidney disease, cardiac disease — can have T4 values suppressed into the normal range despite active hyperthyroidism. Early or subclinical cases fluctuate in and out of the reference range. Cats with palpable thyroid nodules may present with a normal T4 entirely. The 2016 AAFP Guidelines for the Management of Feline Hyperthyroidism organize these challenging cases into distinct diagnostic categories — each requiring a different approach — underscoring why a second, confirmatory test is often essential. 

Why Total T4 + Feline-Optimized TSH Is the Right Combination 

In hyperthyroidism, autonomous T4 production suppresses TSH through negative feedback — and this suppression occurs early, often before T4 has risen significantly above the reference range. A sensitive TSH assay that detects pituitary suppression can therefore serve as a confirmatory test even in cats with borderline T4 values. 

Free T4 by equilibrium dialysis has been proposed as an alternative, but its specificity drops to approximately 85% — meaning up to 15% of cats without hyperthyroidism will test high. A high free T4 alone cannot confirm disease. For these reasons, free T4 is not a reliable standalone confirmatory test, and combining it with total T4 still leaves a meaningful diagnostic gap. 

The Assay Sensitivity Problem — and How Feline-Optimized TSH Solves It 

The traditional canine TSH assay used at reference laboratories has a lower limit of detection of 0.03 ng/mL. But the normal TSH range in cats extends down to 0.01 ng/mL — meaning many confirmed hyperthyroid cats fall below the canine assay’s detection threshold and are indistinguishable from cats with low-normal TSH due to non-thyroidal illness. The resulting performance numbers reflect this limitation: the canine chemiluminescent assay achieves only 79% sensitivity, 76% specificity, and a 21% positive predictive value for feline hyperthyroidism. That is not adequate for clinical confirmation. 

The TRUFORMA in-clinic biosensor testing platform uses bulk acoustic wave (BAW) technology to run a feline-optimized TSH assay with a lower limit of detection of 0.008 ng/mL — well below the threshold where feline hyperthyroid cats become undetectable on the canine assay. Independent validation data show 90% sensitivity, 98% specificity, and a positive predictive value of approximately 87%. A cat with a TSH below 0.01 ng/mL has strong evidence of hyperthyroidism; a cat above 0.01 ng/mL is more likely euthyroid or suffering from a non-thyroidal illness. Running T4 and feline-optimized TSH together takes less than 40 minutes in-clinic and delivers a clear, evidence-based path forward. As Today’s Veterinary Business notes, the TRUFORMA platform was specifically developed to provide reference laboratory accuracy at the point of care using BAW technology — the same approach used in telecommunications and aerospace for decades. 

Using TSH to Monitor Post-Treatment Thyroid Status 

TSH testing is not only valuable at diagnosis — it plays an equally important role in monitoring cats following radioiodine (I-131) therapy or methimazole treatment. Up to 50% of cats treated with radioiodine experience transient iatrogenic hypothyroidism in the first 30 to 60 days. The clinical signs — weight gain, reduced activity, normal appetite — are easily confused with successful treatment response, making laboratory monitoring essential rather than optional. Cornell University’s Feline Health Center notes that radioiodine is curative in approximately 95% of hyperthyroid cases, which makes preserving renal function post-treatment a primary long-term concern. 

Recommended post-treatment monitoring includes T4, TSH, and a renal panel at days 30, 60, 90, and 180. Successful treatment looks like T4 in the normal range (above 1.5 mcg/dL), TSH returning to a detectable level as the hypothalamic-pituitary-thyroid axis recovers, and stable creatinine. Cats with persistently low T4 and elevated TSH above 0.15 ng/mL at the 6-month mark should be started on levothyroxine. Any cat showing rising creatinine or SDMA in the context of low T4 and elevated TSH should be supplemented earlier — protecting GFR is the priority. 

The Case for Point-of-Care Testing in Feline Medicine 

Send-out laboratory testing is reliable — but it introduces delays that shift decision-making out of the appointment and into a follow-up phone call. The visit ends without direction and treatment starts a day later than it could have. For cats who deteriorate quickly, especially those with active cobalamin deficiency and concurrent intestinal disease, that gap has clinical consequences. 

Every day a result is delayed is a day treatment doesn’t start. Point-of-care testing eliminates that gap entirely. Cobalamin supplementation can be initiated before the cat leaves the building. A low folate result prompts an immediate conversation about upper GI imaging while the client is still in the room. A suppressed TSH alongside an elevated T4 opens the door to a same-visit discussion of methimazole versus radioiodine referral. That kind of real-time clinical reasoning is better for patients, more satisfying for clients, and more efficient for the practice. 

The TRUFORMA in-clinic biosensor testing platform runs quantitative immunoassays using bulk acoustic wave technology — a non-optical, fluorescence-free detection method that is less susceptible to the interference risks associated with chemiluminescent or enzyme-linked assays. Hemolysis and lipemia, which can affect send-out sample integrity, are thought to have less impact on BAW-based results. The platform currently supports feline cobalamin, folate, total T4, and feline-optimized TSH, plus additional assays for canine diagnostic testing. More than 18 veterinary universities currently use the platform. 

Conclusion 

Feline medicine demands diagnostic tools that match how cats present: subtly, quickly, and often with multiple conditions in play. The ability to run cobalamin, folate, and a feline-optimized thyroid panel in-clinic — and have results before the appointment ends — is not just a workflow improvement. It is a clinical edge. The feline-optimized TSH assay in particular addresses a gap that has frustrated practitioners for years, providing a confirmatory result for hyperthyroidism that the canine assay could not reliably deliver. For any practice seeing a meaningful volume of feline patients, in-clinic access to these tests is one of the higher-impact diagnostic upgrades available today. 


Ready to learn more?
Explore TRUFORMA® assays and see how point-of-care biosensor testing can support your feline patients. Visit zomedica.com to learn more about the TRUFORMA in-clinic biosensor testing platform. 

©2026 Zomedica Inc. All rights reserved. TRUFORMA is a registered trademark of Zomedica Inc. 
*Dr. Oswald is a paid consultant for Zomedica, Inc. 

 
Disclaimer: The information provided on this blog is for general informational and educational purposes only. It is not intended as medical advice and should not be used as a substitute for professional medical guidance. Always consult a qualified healthcare provider before making any health‑related decisions. 

Header Image (1)

Why High-Frequency Temperature Monitoring Is Critical in Veterinary Medicine 

Body temperature is one of the most fundamental indicators of health in veterinary patients and one of the most underutilized. Accurate and consistent temperature monitoring is far more than a routine step in a physical exam. It is a cornerstone of animal health assessment across every clinical context: the neonate, the anesthetized surgical patient, the hospitalized ICU case, the animal presenting for a routine wellness visit. In each of these settings, temperature provides essential insight into thermoregulation, immune status, metabolic activity, and overall physiological stability. 

In a field where patients cannot verbally describe how they feel, vigilant temperature assessment is indispensable. This article explores what abnormal temperature values indicate, when monitoring is most critical, the limitations of traditional approaches, and how high frequency remote monitoring technology is expanding what is clinically possible. 

What Body Temperature Tells Us About Animal Health 

Temperature reflects the balance between heat production and heat loss. Even small deviations from normal can signal disease, stress, environmental exposure, or metabolic dysfunction. Because normal ranges vary by species, age, and physiological state, trend monitoring over time is often more clinically valuable than a single reading. A temperature that is numerically within range may still be abnormal for a specific patient if it represents a meaningful deviation from their individual baseline. 

Fever vs. Hyperthermia: Understanding Elevated Temperature in Veterinary Patients 

Elevated body temperature arises from two distinct mechanisms — and differentiating between them matters clinically. The treatment approach, urgency, and underlying workup are different for each. 

Fever (Pyrexia) 

Fever occurs when the hypothalamic set point is elevated in response to circulating endogenous or exogenous pyrogens. This is a regulated heat elevation — the body is intentionally raising its own temperature as part of an immune response. Common causes include infection, immune-mediated disease, neoplasia, drug reactions, and inflammatory disorders. While fever can be a protective mechanism that enhances immune cell efficiency and inhibits pathogen replication, sustained high fever increases metabolic demand, contributes to dehydration, and can lead to systemic complications if left unaddressed. 

Hyperthermia 

Hyperthermia occurs when excessive heat production or environmental heat load overwhelms the body’s cooling mechanisms, while the hypothalamic set point remains unchanged. This is unregulated heat elevation. Common scenarios include heatstroke, overexertion in brachycephalic or respiratory-compromised patients, toxin exposure, malignant hyperthermia, and airway or neurologic disease that limits heat dissipation — such as laryngeal paralysis. Hyperthermia, particularly in the context of heatstroke, can be life-threatening and requires immediate identification and intervention. 

Hypothermia: An Equally Important and Frequently Overlooked Concern 

Lower-than-normal body temperature carries significant clinical risk — particularly in small patients, neonates, and geriatric animals, all of whom are highly susceptible to heat loss. Common causes of hypothermia include environmental exposure, shock or sepsis, anesthesia and sedation, endocrine disease, and severe malnutrition. 

Hypothermia is dangerous because it slows metabolism, decreases drug clearance, alters coagulation, reduces cardiac output, and impairs immune function. In neonates, hypothermia can deteriorate rapidly due to limited glycogen reserves and the inability to shiver. Early recognition is essential — outcomes are significantly better when hypothermia is identified and addressed before it becomes severe. 

Temperature Monitoring During Anesthesia 

Few clinical situations demand more diligence to temperature than the anesthetized patient. All anesthetic agents impair thermoregulation to some degree. Most anesthetized patients experience a combination of heat loss mechanisms: vasodilation, a decreased or absent shivering response, exposure of body cavities during surgery, conductive and evaporative loss from the table surface, and the administration of room-temperature intravenous fluids. 

Unaddressed perioperative hypothermia is not a minor inconvenience — it increases the risk of prolonged recovery, bradycardia, hypotension, coagulopathy, altered drug metabolism, and postoperative infection. Frequent temperature monitoring during anesthesia, ideally in real time, allows the surgical and recovery teams to detect trends early and intervene before hypothermia becomes a patient safety concern. 

Monitoring temperature at induction, at regular intervals throughout the procedure, and during recovery gives clinicians the information they need to make timely decisions about warming support — without waiting for visible clinical signs of deterioration. 

Temperature Monitoring in the ICU and Hospitalized Patient 

Hospitalized patients — particularly those in intensive care — benefit significantly from frequent temperature assessment. Abnormal temperature trends often precede observable clinical deterioration, which makes temperature an early warning indicator rather than a lagging one. 

In critical care, temperature is not merely a number — it is a dynamic indicator of shifting physiology. A patient whose temperature is trending downward at 3:00 a.m. is giving the care team information, even before other vital signs change. High-frequency monitoring enables earlier detection of sepsis or infection, provides real-time insight into response to treatment, helps evaluate perfusion and metabolic status, and can identify complications such as transfusion reactions or adverse drug responses before they escalate. 

The challenge is that the frequency of monitoring required to capture these trends is often impractical with manual rectal thermometry alone — particularly during overnight hours or periods of high patient volume. 

Challenges in Traditional Temperature Measurement 

Rectal thermometry remains the clinical gold standard for accuracy, but it comes with practical limitations that affect how consistently and frequently it can be used: 

  • Patient stress and fractious behavior: Repeated handling increases anxiety in fearful or painful patients and can introduce inaccuracy into readings by elevating temperature through stress response. 
  • Staff safety: Aggressive patients present real risk during restraint for temperature assessment. 
  • Disruption to rest and recovery: Patients recovering from surgery or managing critical illness need undisturbed rest. Frequent manual checks interfere with that. 
  • Infection control: Rectal thermometry requires contact and equipment management that adds to cleaning burden and introduces cross-contamination risk in isolation settings. 
  • Staffing constraints: The frequency of monitoring that would be most clinically valuable is often not achievable given real-world staffing levels and competing demands on veterinary teams. 

These limitations do not diminish the value of manual temperature assessment — they highlight the need for complementary approaches, particularly for high frequency monitoring or in patients where frequent handling is contraindicated. 

How Remote Monitoring Technology Is Changing What Is Possible 

Modern veterinary medicine is increasingly adopting monitoring tools that allow clinicians to capture temperature data more continuously, more safely, and with less disruption to the patient. Radar-based and infrared technologies have made it possible to monitor body temperature without physical contact — reducing stress, improving staff safety, and enabling uninterrupted data collection. 

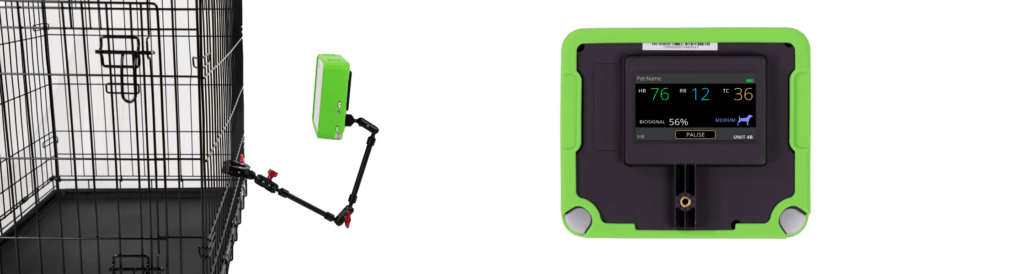
Zomedica’s VETGuardian PLUS™ Remote Monitor uses this approach to provide high-frequency, contactless temperature monitoring alongside pulse and respiration rate. Because it does not require repeated patient handling, the VETGuardian PLUS monitor is particularly well-suited for surgical recovery, ICU monitoring, and patients who cannot be safely or comfortably handled at regular intervals. Configurable alert thresholds allow the care team to be notified when values fall outside expected ranges — supporting earlier intervention without requiring constant manual checks. 

The ability to monitor more patients more consistently, with less disruption and less burden on clinical staff, represents a meaningful shift in what high-frequency monitoring looks like in practice. 

Conclusion 

Temperature monitoring is one of the simplest and most powerful tools in veterinary medicine. It provides early clues to underlying disease, guides therapeutic decision-making, and ensures patient safety across a wide range of clinical scenarios — from anesthesia care to critical illness to routine wellness visits. 

As technologies that support high frequency and contactless monitoring continue to evolve, veterinarians gain increasing ability to monitor temperature with greater frequency, greater accuracy, and less stress to the patient. Whether measured through traditional rectal thermometry or via emerging remote systems, temperature remains a foundational vital sign — one that no clinician can afford to overlook. 

Learn more about the VETGuardian PLUS™ Remote Monitor at zomedica.com. 

© 2026 Zomedica Inc. All rights reserved. The VETGuardian PLUS™ Remote Monitor is a registered trademark of Zomedica Inc. 
 Disclaimer: The information provided on this blog is for general informational and educational purposes only. It is not intended as medical advice and should not be used as a substitute for professional medical guidance. Always consult a qualified healthcare provider before making any health‑related decisions.

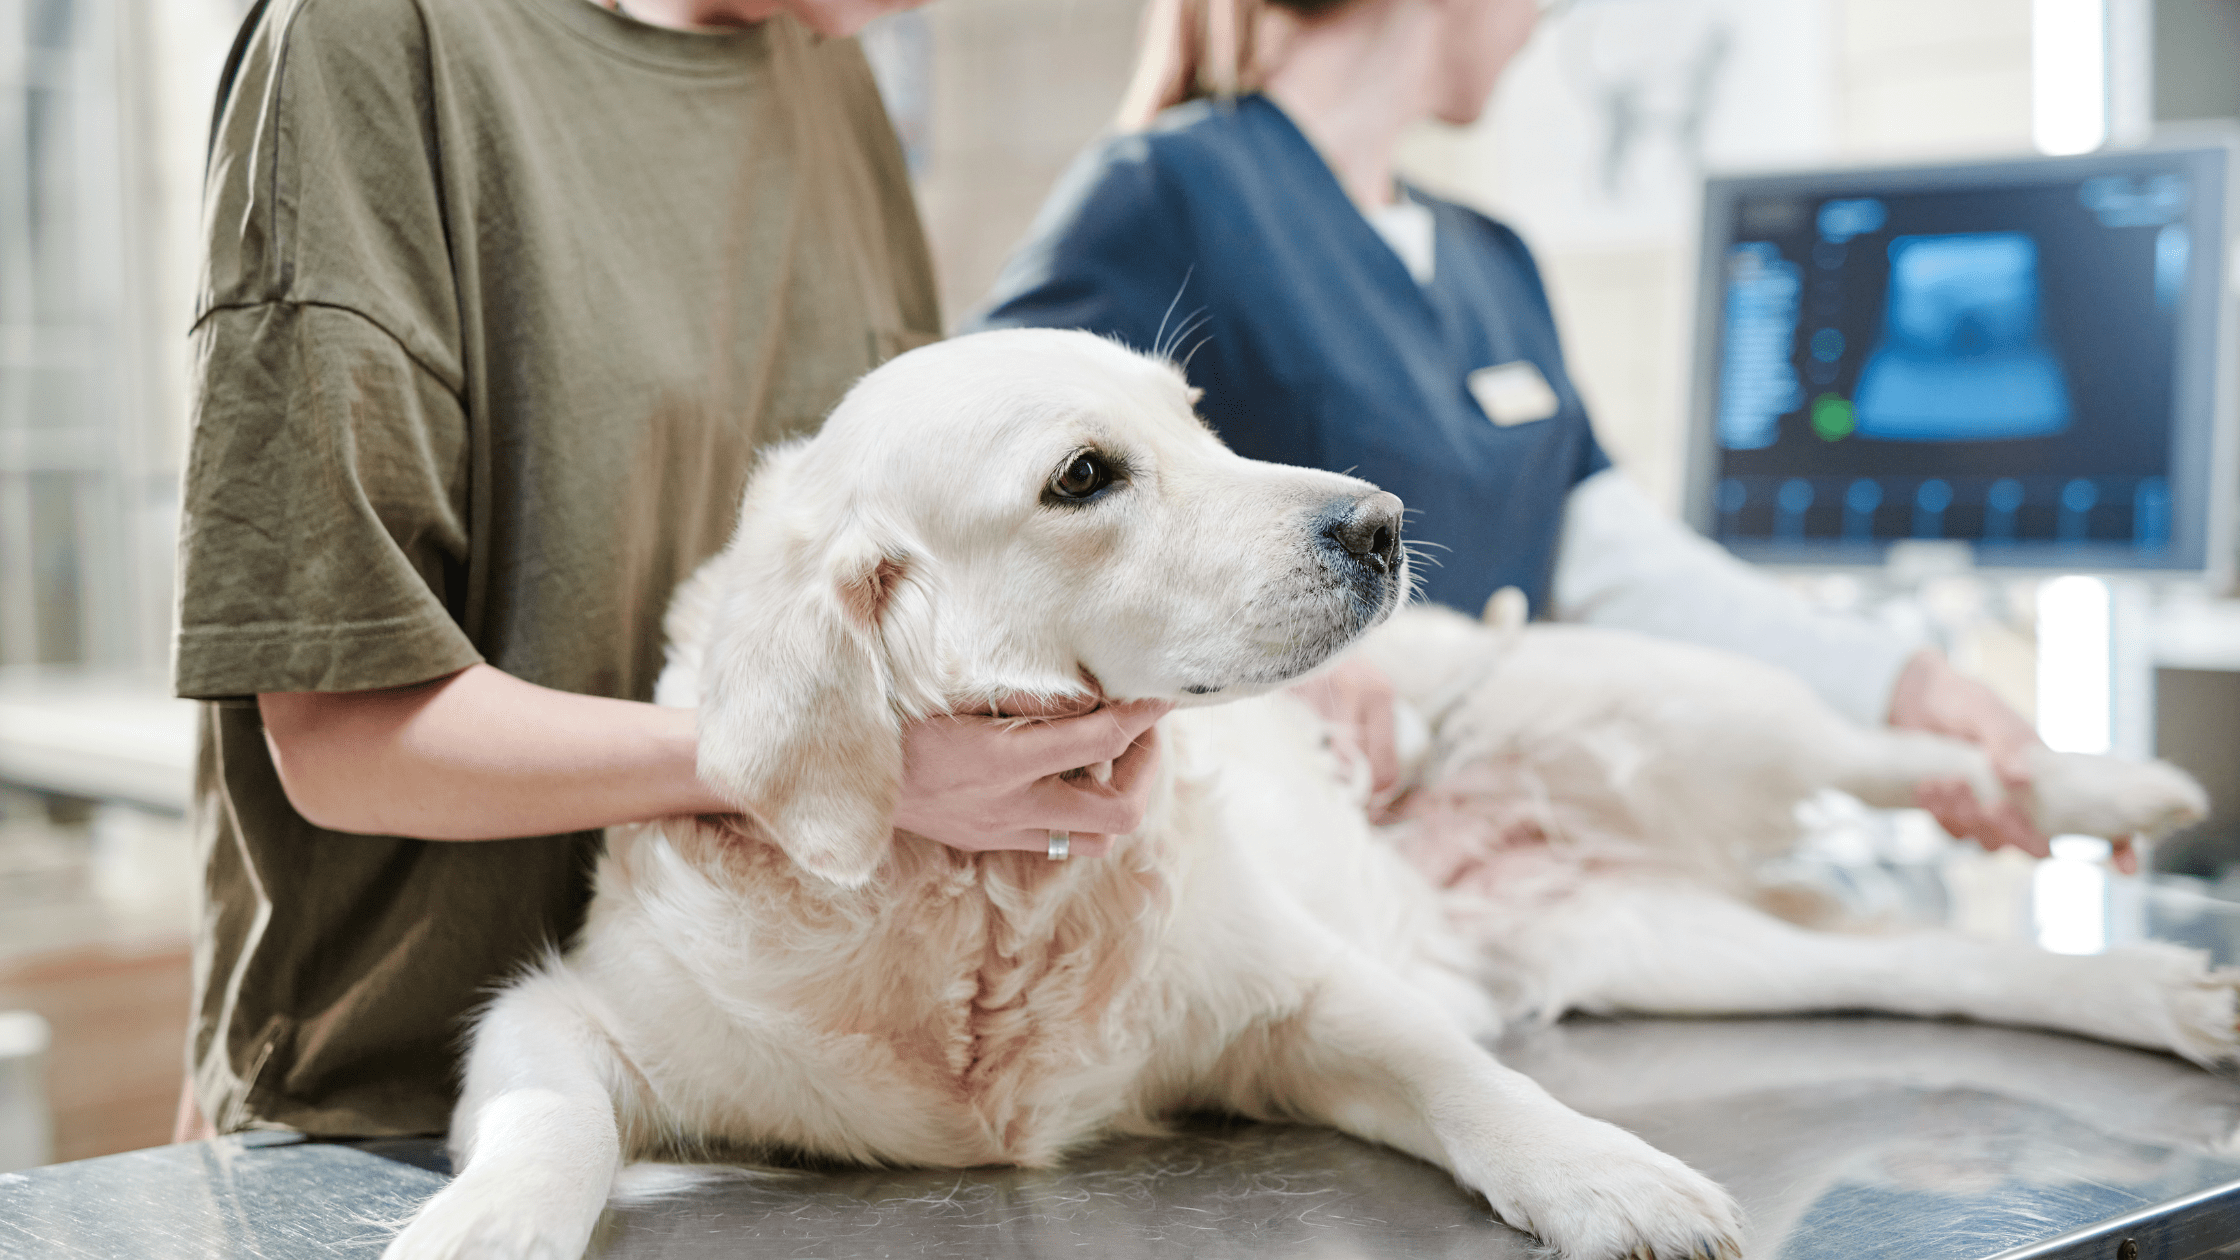
Golden retriever lying on a veterinary exam table during an ultrasound procedure, with a technician and ultrasound monitor visible in the background

Canine Kidney Ultrasound: Technique, Transducer Selection, and What to Look For

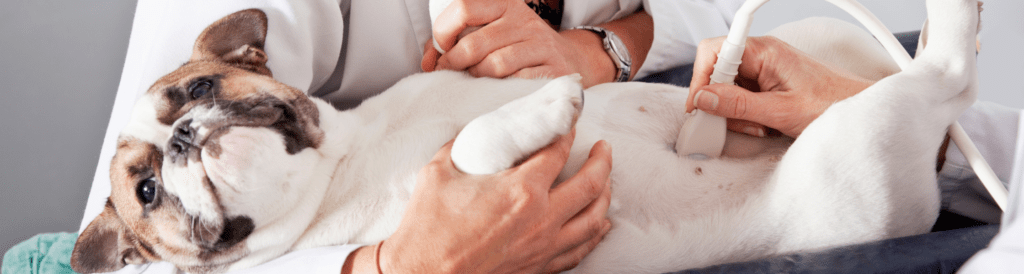
Renal ultrasound is one of those skills that looks deceptively straightforward on paper—until you’re wedged between a squirming dog, a dimly lit room, and limited acoustic windows that make every image harder to acquire. Done well, it’s one of the most clinically valuable tools in your diagnostic arsenal. Done carelessly, it’s an expensive way to not find a kidney. 

Whether you’re building your ultrasound confidence from scratch or looking for a technique refresher, this guide covers the essentials of canine kidney scanning: patient prep, transducer selection, systematic evaluation, and what normal actually looks like—so you’ll recognize when something isn’t. 

Step One: Give Yourself a Fighting Chance with Patient Prep 

Before a single image is acquired, how well you prepare the patient will determine how good your scan can possibly be. No amount of technical skill compensates for poor acoustic contact, and nothing undermines acoustic contact faster than an unclipped coat. 

When scanning canine kidneys, clip the hair over the last two to three intercostal spaces and extend the clip dorsally. This step is non-negotiable. Trying to image through an intact coat introduces artifact and signal loss that no transducer can overcome—and it turns what should be a focused diagnostic exam into an exercise in frustration. 

Once clipped, apply generous acoustic coupling gel and position your patient in dorsal or lateral recumbency depending on your preferred approach. Taking a moment to get comfortable before you start scanning pays off: ergonomics matter when you’re holding a transducer steady and interpreting images simultaneously. 

Transducer Selection: Matching the Tool to the Patient 

Transducer choice shapes the quality of everything you see. The two variables to get right are footprint size and frequency, and both are largely determined by the patient in front of you and the imaging window you’re working through. 

Footprint: Intercostal vs. Subcostal Approach 

For intercostal imaging, a small-footprint transducer is essential. It fits cleanly between the ribs without the rib-shadow interference that wider probes create, giving you the access you need without compromising image quality. For subcostal views, spatial constraints relax and a larger curved array probe is appropriate—one that delivers a wider field of view and better penetration for deeper structures. 

Frequency: Balancing Depth and Resolution 

In most dogs, a 5–10 MHz transducer covers the range well. Higher frequencies give better spatial resolution at shallower depths; lower frequencies penetrate more deeply at some cost to fine structural detail. Patient size should guide your selection: 

  • Giant breeds: Plan on greater tissue depth. Lower frequencies within your range will be necessary for adequate penetration. 
  • Average-sized dogs: A 5–10 MHz transducer handles most patients comfortably. 
  • Cats and small dogs: Higher frequencies are required for the resolution needed to image small kidneys. These patients also tend to be less cooperative, which adds its own dimension to the challenge. 

Getting frequency right from the start means less time chasing a blurry image and more time actually interpreting one. 

The SonoView® ultrasound system’s wireless, multi-array design—combining curved array, phased array, and linear array in one unit—gives you the flexibility to adapt your approach across patient sizes without changing equipment. Learn more about the SonoView ultrasound system. 

Scanning Technique: Be Systematic 

Once your patient is prepped and your transducer is in position, systematic evaluation is everything. The most common scanning error isn’t a technical failure—it’s an incomplete one. 

Fully evaluate each kidney in both long axis and short axis—and importantly, “long” and “short” here are relative to the kidney itself, not the spine. Renal orientation varies between patients, and if you’re aligning your imaging planes to the spine rather than the organ, you’ll miss lesions that only reveal themselves off-axis. 

Work through each kidney methodically: every cortical surface, every medullary pyramid, the renal pelvis, and the hilus. Subtle findings—early cysts, small masses, focal infarcts—are exactly the things that disappear when you rush. When something looks unusual, fan through it in multiple planes before moving on. Confirming whether a finding is real, incidental, or artifact takes an extra thirty seconds and saves a great deal of diagnostic uncertainty later. 

Don’t Skip the Hilus 

The renal hilus—where the vasculature, ureter, and renal pelvis converge—deserves deliberate attention and is easy to gloss over in a rushed exam. Dilation of the proximal ureter, vascular irregularities, and pelvic changes can all be detected here when you look for them specifically. 

Assessing Kidney Size: Radiographs and Ultrasound Each Have a Role 

Renal size assessment draws on both modalities, and knowing the standards for each keeps your diagnostic picture complete. 

Radiographic Sizing: The L2 Standard 

On ventrodorsal radiographs, the gold standard for renal sizing in dogs is comparing each kidney to the length of the L2 vertebral body. Normal canine kidneys measure approximately 2.5 to 3.5 times the length of L2. Anything outside that range warrants follow-up. Kidneys that are too small suggest chronic disease; kidneys that are too large may indicate infiltrative disease, obstruction, or neoplasia. 

Ultrasound Sizing: Architecture Matters as Much as Dimensions 

On ultrasound, size is only one part of what you’re evaluating. Architecture is equally informative—sometimes more so. The kidneys should be symmetrical in size and shape, with smooth, well-defined capsular margins. Asymmetry between the two kidneys, irregular or indistinct margins, or disrupted internal organization are all findings that warrant closer investigation and, often, specialist consultation. 

Always compare left and right. A kidney that appears unremarkable in isolation may look significantly abnormal when placed next to its counterpart. 

The SonoView® ultrasound system is designed for in-clinic use with expert backup when you need it—so you can evaluate complex cases confidently without sending every patient out. Request more information on the SonoView proctored model. 

Normal Ultrasound Findings: What You Should Expect to See 

Reliable identification of abnormal findings starts with a thorough understanding of normal ones. Healthy canine kidneys on ultrasound should be symmetrical, smooth-margined, and well-organized internally. Here’s what to expect in a normal patient. 

Corticomedullary Contrast 

There should be a clear, visible difference in echogenicity between the cortex and the medulla. The cortex appears more echogenic—brighter—than the medulla. This corticomedullary distinction is one of the most reliable markers of normal renal architecture on ultrasound. When it’s lost, blurred, or reversed, you’re looking at a finding that warrants attention. Conditions such as chronic kidney disease, glomerulonephritis, and various infiltrative processes can all disrupt this boundary in characteristic ways. 

The Renal Pelvis 

The renal pelvis may be visible on your scan, and in a normal patient that’s expected—as long as it remains unobtrusive. In normal dogs, the renal pelvis measures less than 2 mm. If it’s within that range and unremarkable in appearance, note it and move on. 

If the renal pelvis is enlarged or prominent, that finding warrants investigation. Pelvic dilation can indicate hydronephrosis, obstruction, infection, or pyelonephritis—none of which should go unaddressed. 

Which brings us to the one rule in this guide that is entirely non-negotiable: always scan the bladder. If the renal pelvis looks abnormal, scan the bladder. If everything looks normal, scan the bladder anyway. Hydronephrosis, ureterolithiasis, and lower urinary tract disease often announce themselves—or at least hint at themselves—downstream. Skipping the bladder means skipping half the story. Just kidding about the “if”—always scan the bladder. 

Building Ultrasound Confidence In-Clinic: Where the SonoView® Ultrasound System Comes In 

One of the most persistent barriers to in-house ultrasound isn’t equipment—it’s confidence. Many general practitioners are capable of more than they give themselves credit for, but without structured feedback during the learning curve, skills plateau or go underused. 

The SonoView ultrasound system is designed to address that gap directly. Rather than leaving clinicians to build proficiency on their own, the SonoView system pairs advanced imaging hardware with a proctored learning model: remote expert support available via phone call or tele-presence as you scan your own patients in your own clinic. 

That means you’re not choosing between developing skills and serving patients—you’re doing both simultaneously. You maintain your normal patient load, generate revenue from in-house ultrasound services from day one, avoid the cost and disruption of off-site training, and build genuine diagnostic proficiency over time with expert guidance behind you. 

The SonoView system is available in two configurations: 

  • SonoView Mini-C: USB-powered, designed for point-of-care ultrasound (POCUS) and musculoskeletal imaging with Color Doppler. 
  • SonoView Nano: Wireless system combining curved array, phased array, and linear array in one unit. Operates on iOS, Android, and Windows. 

For general practitioners who perform renal evaluations regularly—or who want to expand into abdominal ultrasound—having reliable, supported in-house imaging changes what’s possible for patients and practice alike. 

Ready to bring proctored ultrasound into your clinic? Learn more about the SonoView ultrasound system. Or read more ultrasound content on the Zomedica blog. 

Quick Reference: Canine Renal Ultrasound at a Glance 

A practical summary of the key technique points covered in this guide: 

  • Prep: Clip the last 2–3 intercostal spaces and extend dorsally before scanning. 
  • Intercostal approach: Use a small-footprint transducer. Subcostal: curved array is appropriate. 
  • Frequency: 5–10 MHz for most dogs. Lower for giant breeds. Higher for cats and small dogs. 
  • Evaluate fully: Long and short axis, oriented to the kidney—not the spine. 
  • Radiographic sizing: Normal kidneys measure 2.5–3.5 × the L2 vertebral body length. 
  • Normal architecture: Symmetrical, smooth margins, distinct corticomedullary contrast. 
  • Renal pelvis: Less than 2 mm in normal dogs. Enlargement warrants investigation. 
  • Always: Scan the bladder. 

©2026 Zomedica Inc. All rights reserved. SONOVIEW is a registered trademark of Zomedica Inc. 
Disclaimer: The information provided on this blog is for general informational and educational purposes only. It is not intended as medical advice and should not be used as a substitute for professional medical guidance. Always consult a qualified healthcare provider before making any health‑related decisions.